ETL, Data Mart, and Sales Analysis Project
Data Flow Overview:
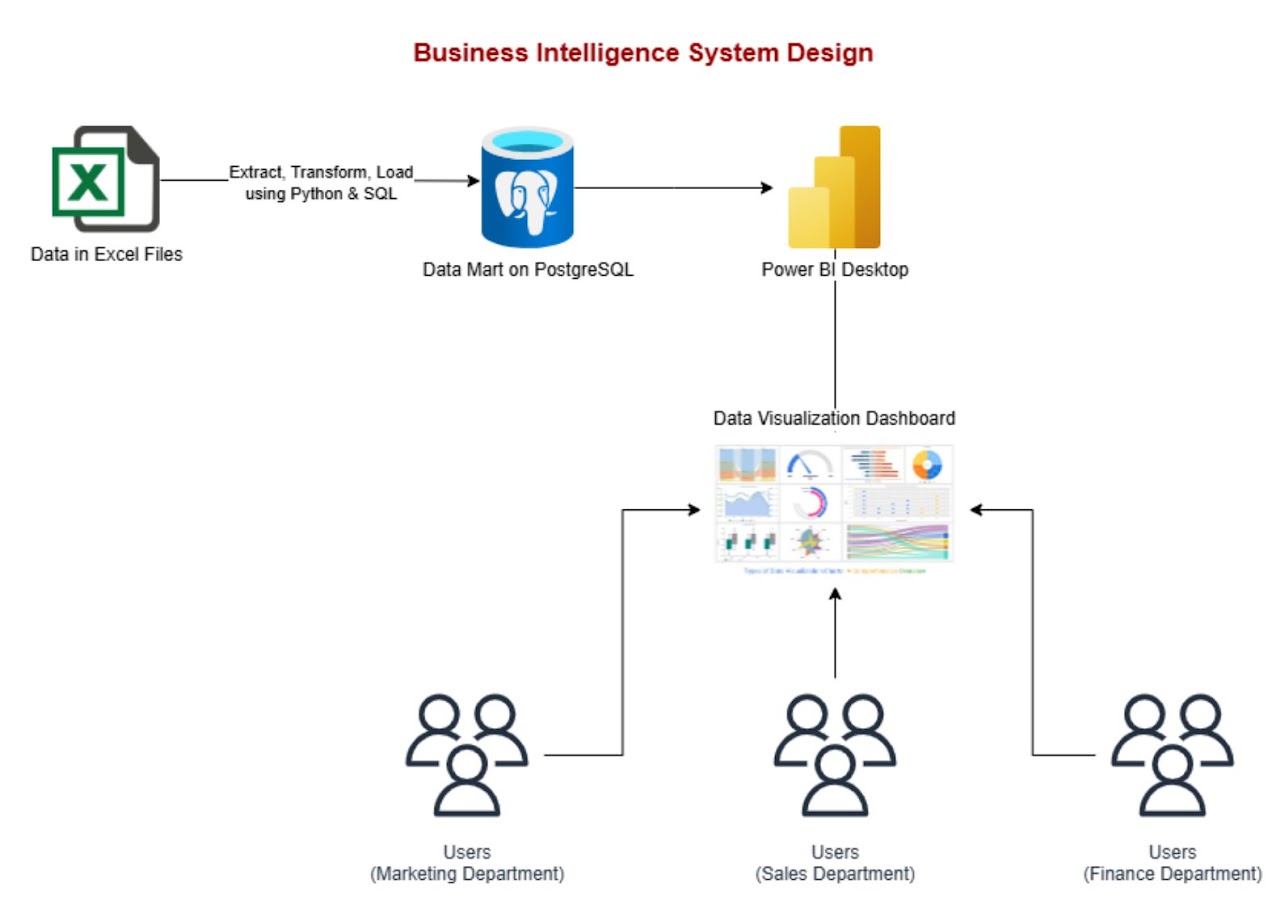
- Source: Sales and operational data are collected from Excel files.
- ETL Process: Data is cleansed, transformed, and loaded into a PostgreSQL Data Mart for structured storage.
- BI Layer: Power BI connects to the data mart to build dynamic reports and visualizations.
- Delivery: Interactive dashboards are published and shared for real-time decision-making.
Dashboard Highlights:
- Time-based sales trends and KPIs
- Product/category performance analysis
- Regional and customer segmentation
- Customizable filters and drilldowns for deeper insights
Value Delivered:
- Streamlined data management
- Centralized and scalable reporting
- Enhanced visibility for stakeholders
- Use the dashboard to monitor performance, identify trends, and support strategic business actions.
You can view the project on GitHub here: GitHub Link